Antarctica sea-ice hits new record
especiales
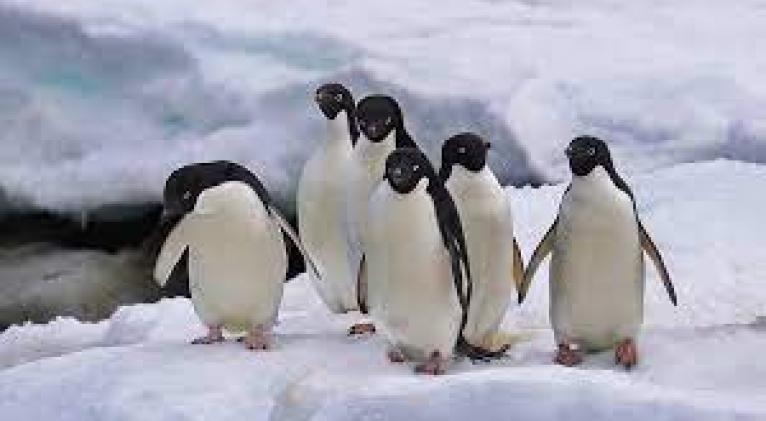
There is now less sea-ice surrounding the Antarctic continent than at any time since we began using satellites to measure it in the late 1970s.
It is the southern hemisphere summer, when you'd expect less sea-ice, but this year is exceptional, according to the National Snow and Ice Data Center.
Winds and warmer air and water reduced coverage to just 1.91 million square km (737,000 sq miles) on 13 February.
What is more, the melt still has some way to go this summer.
Last year, the previous record-breaking minimum of 1.92 million sq km (741,000 sq miles) wasn't reached until 25 February.
Three of the last record-breaking years for low sea-ice have happened in the past seven years: 2017, 2022 and now 2023.
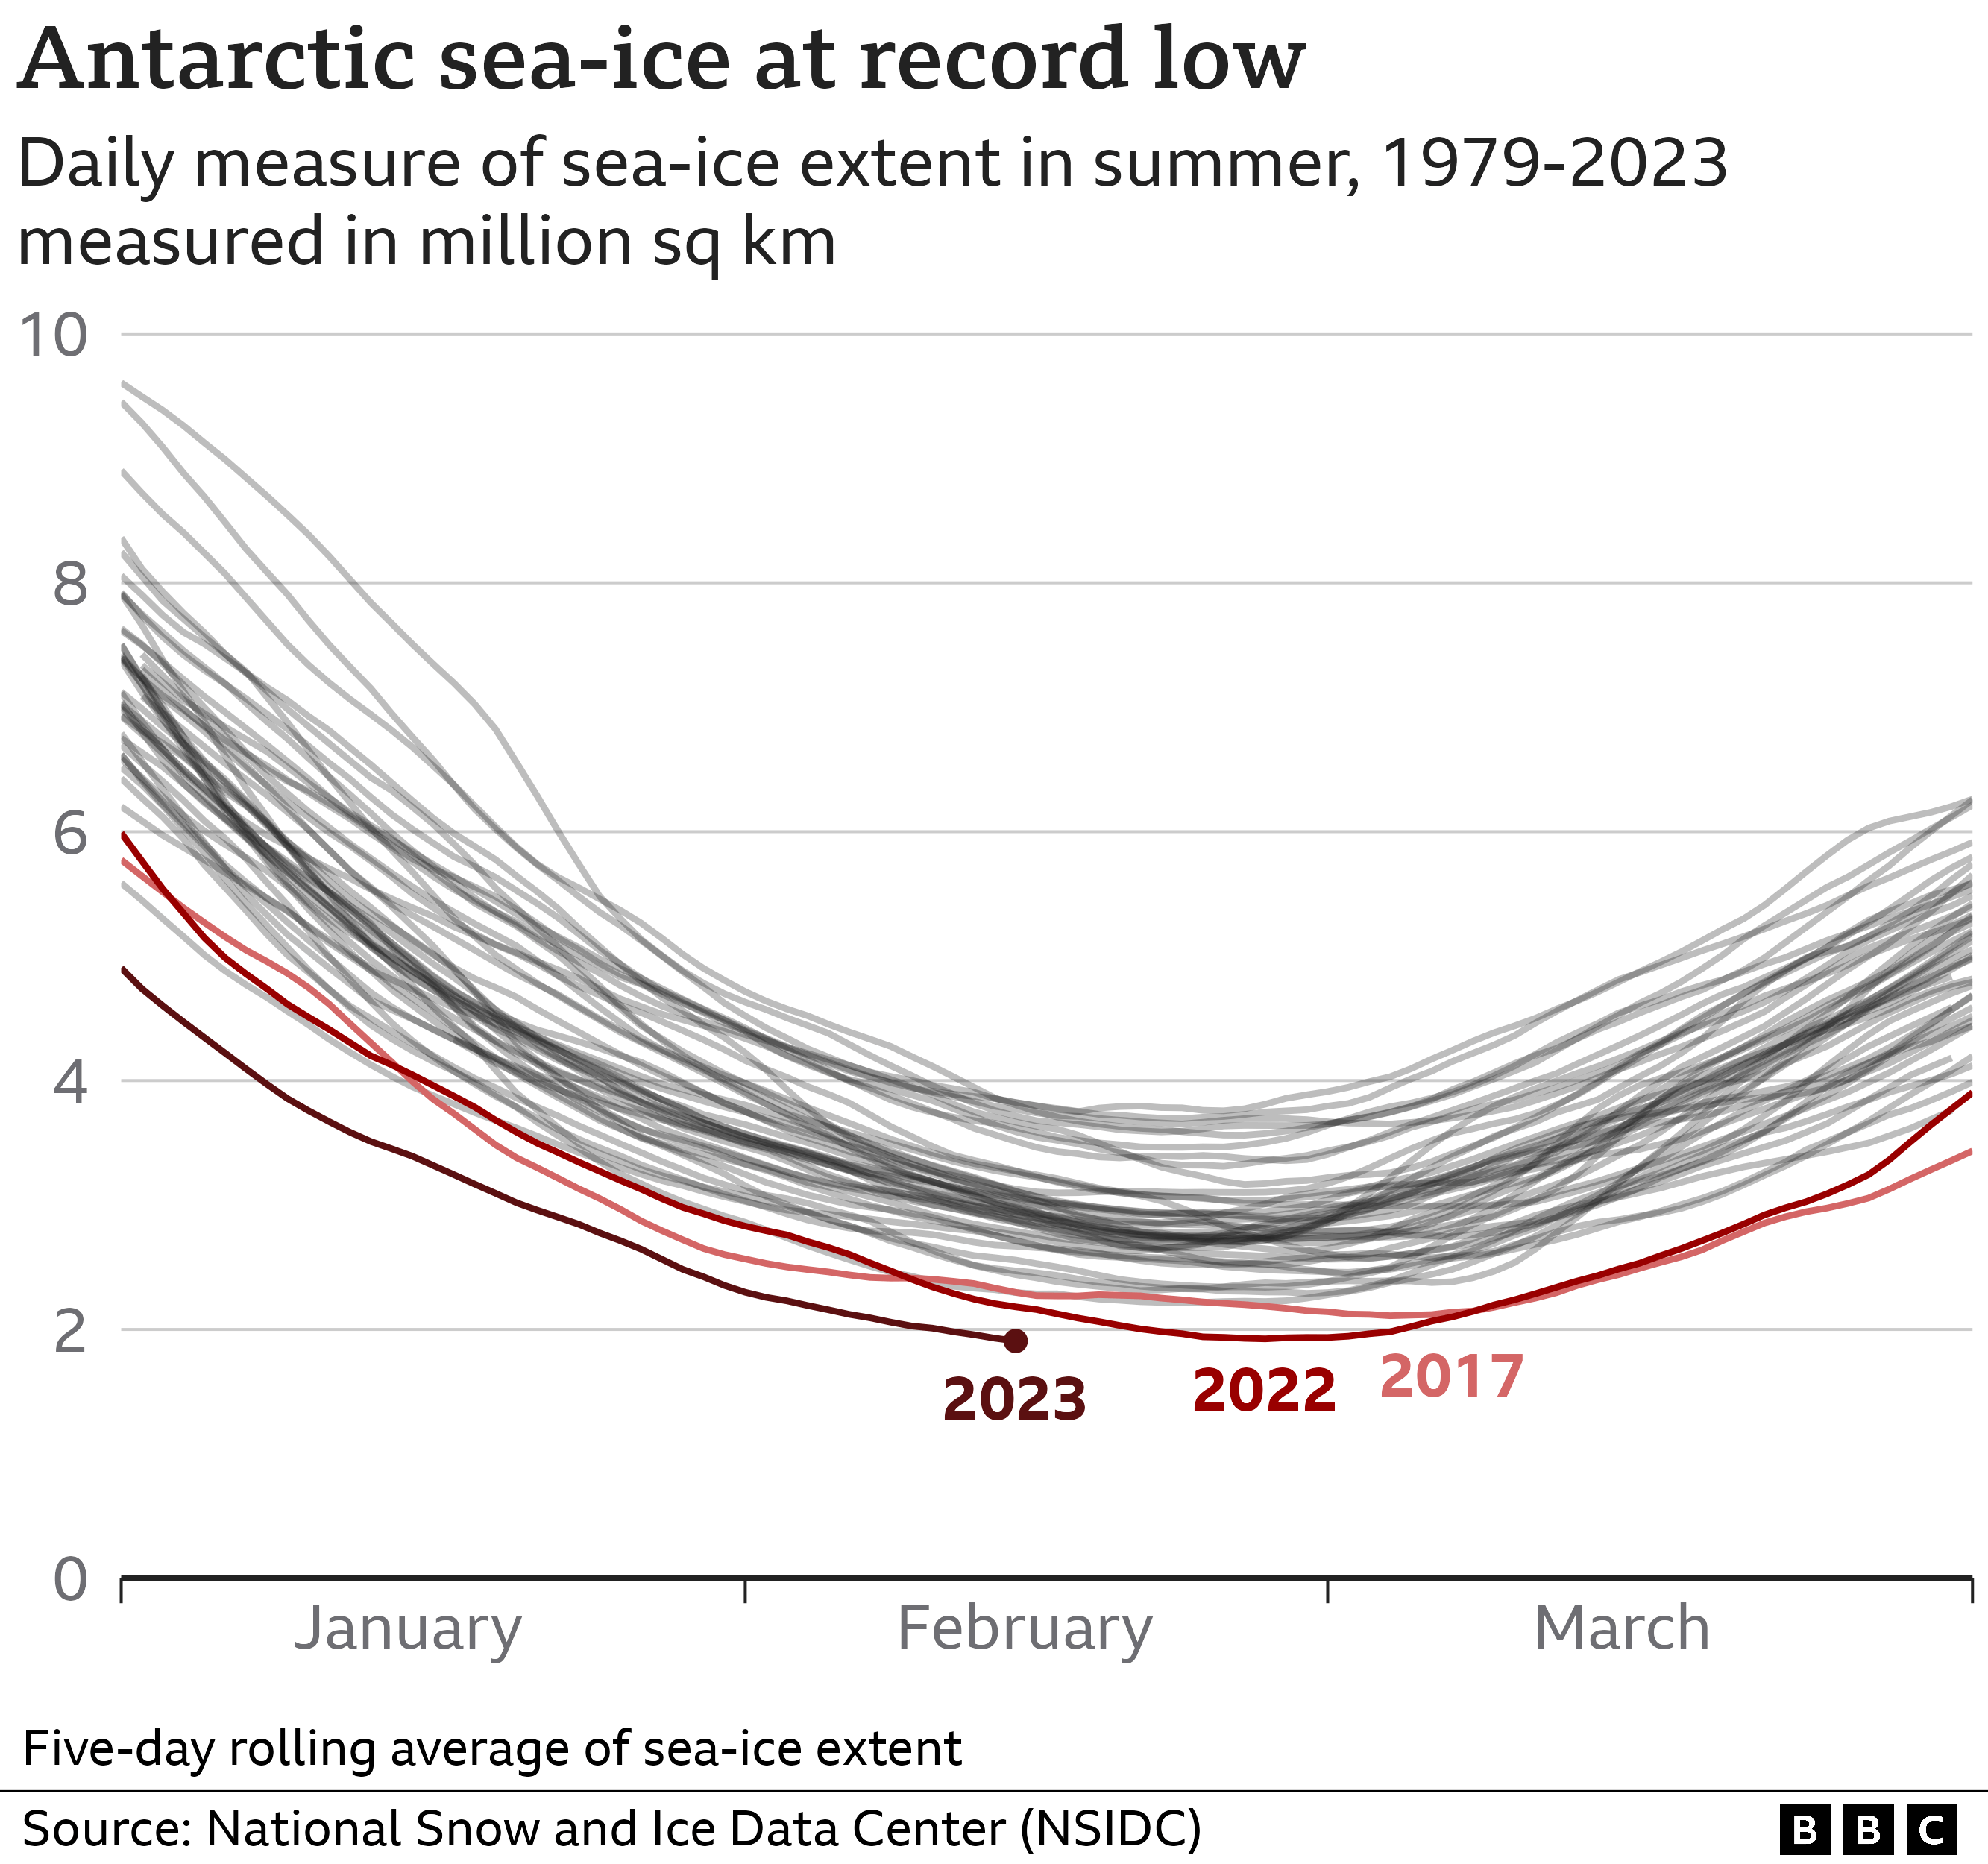
Research, cruise and fishing vessels are all reporting a similar picture as they make passage around the continent: most sectors are virtually ice-free.
Only the Weddell Sea remains dominated by frozen floes.
How unusual is this new record?
Scientists consider the behaviour of Antarctic sea-ice to be a complicated phenomenon which cannot simply be ascribed to climate change.
Looking at the data from the last 40-odd years of available satellite data, the sea-ice extent shows great variability. A downward trend to smaller and smaller amounts of summer ice is only visible in the past few years.
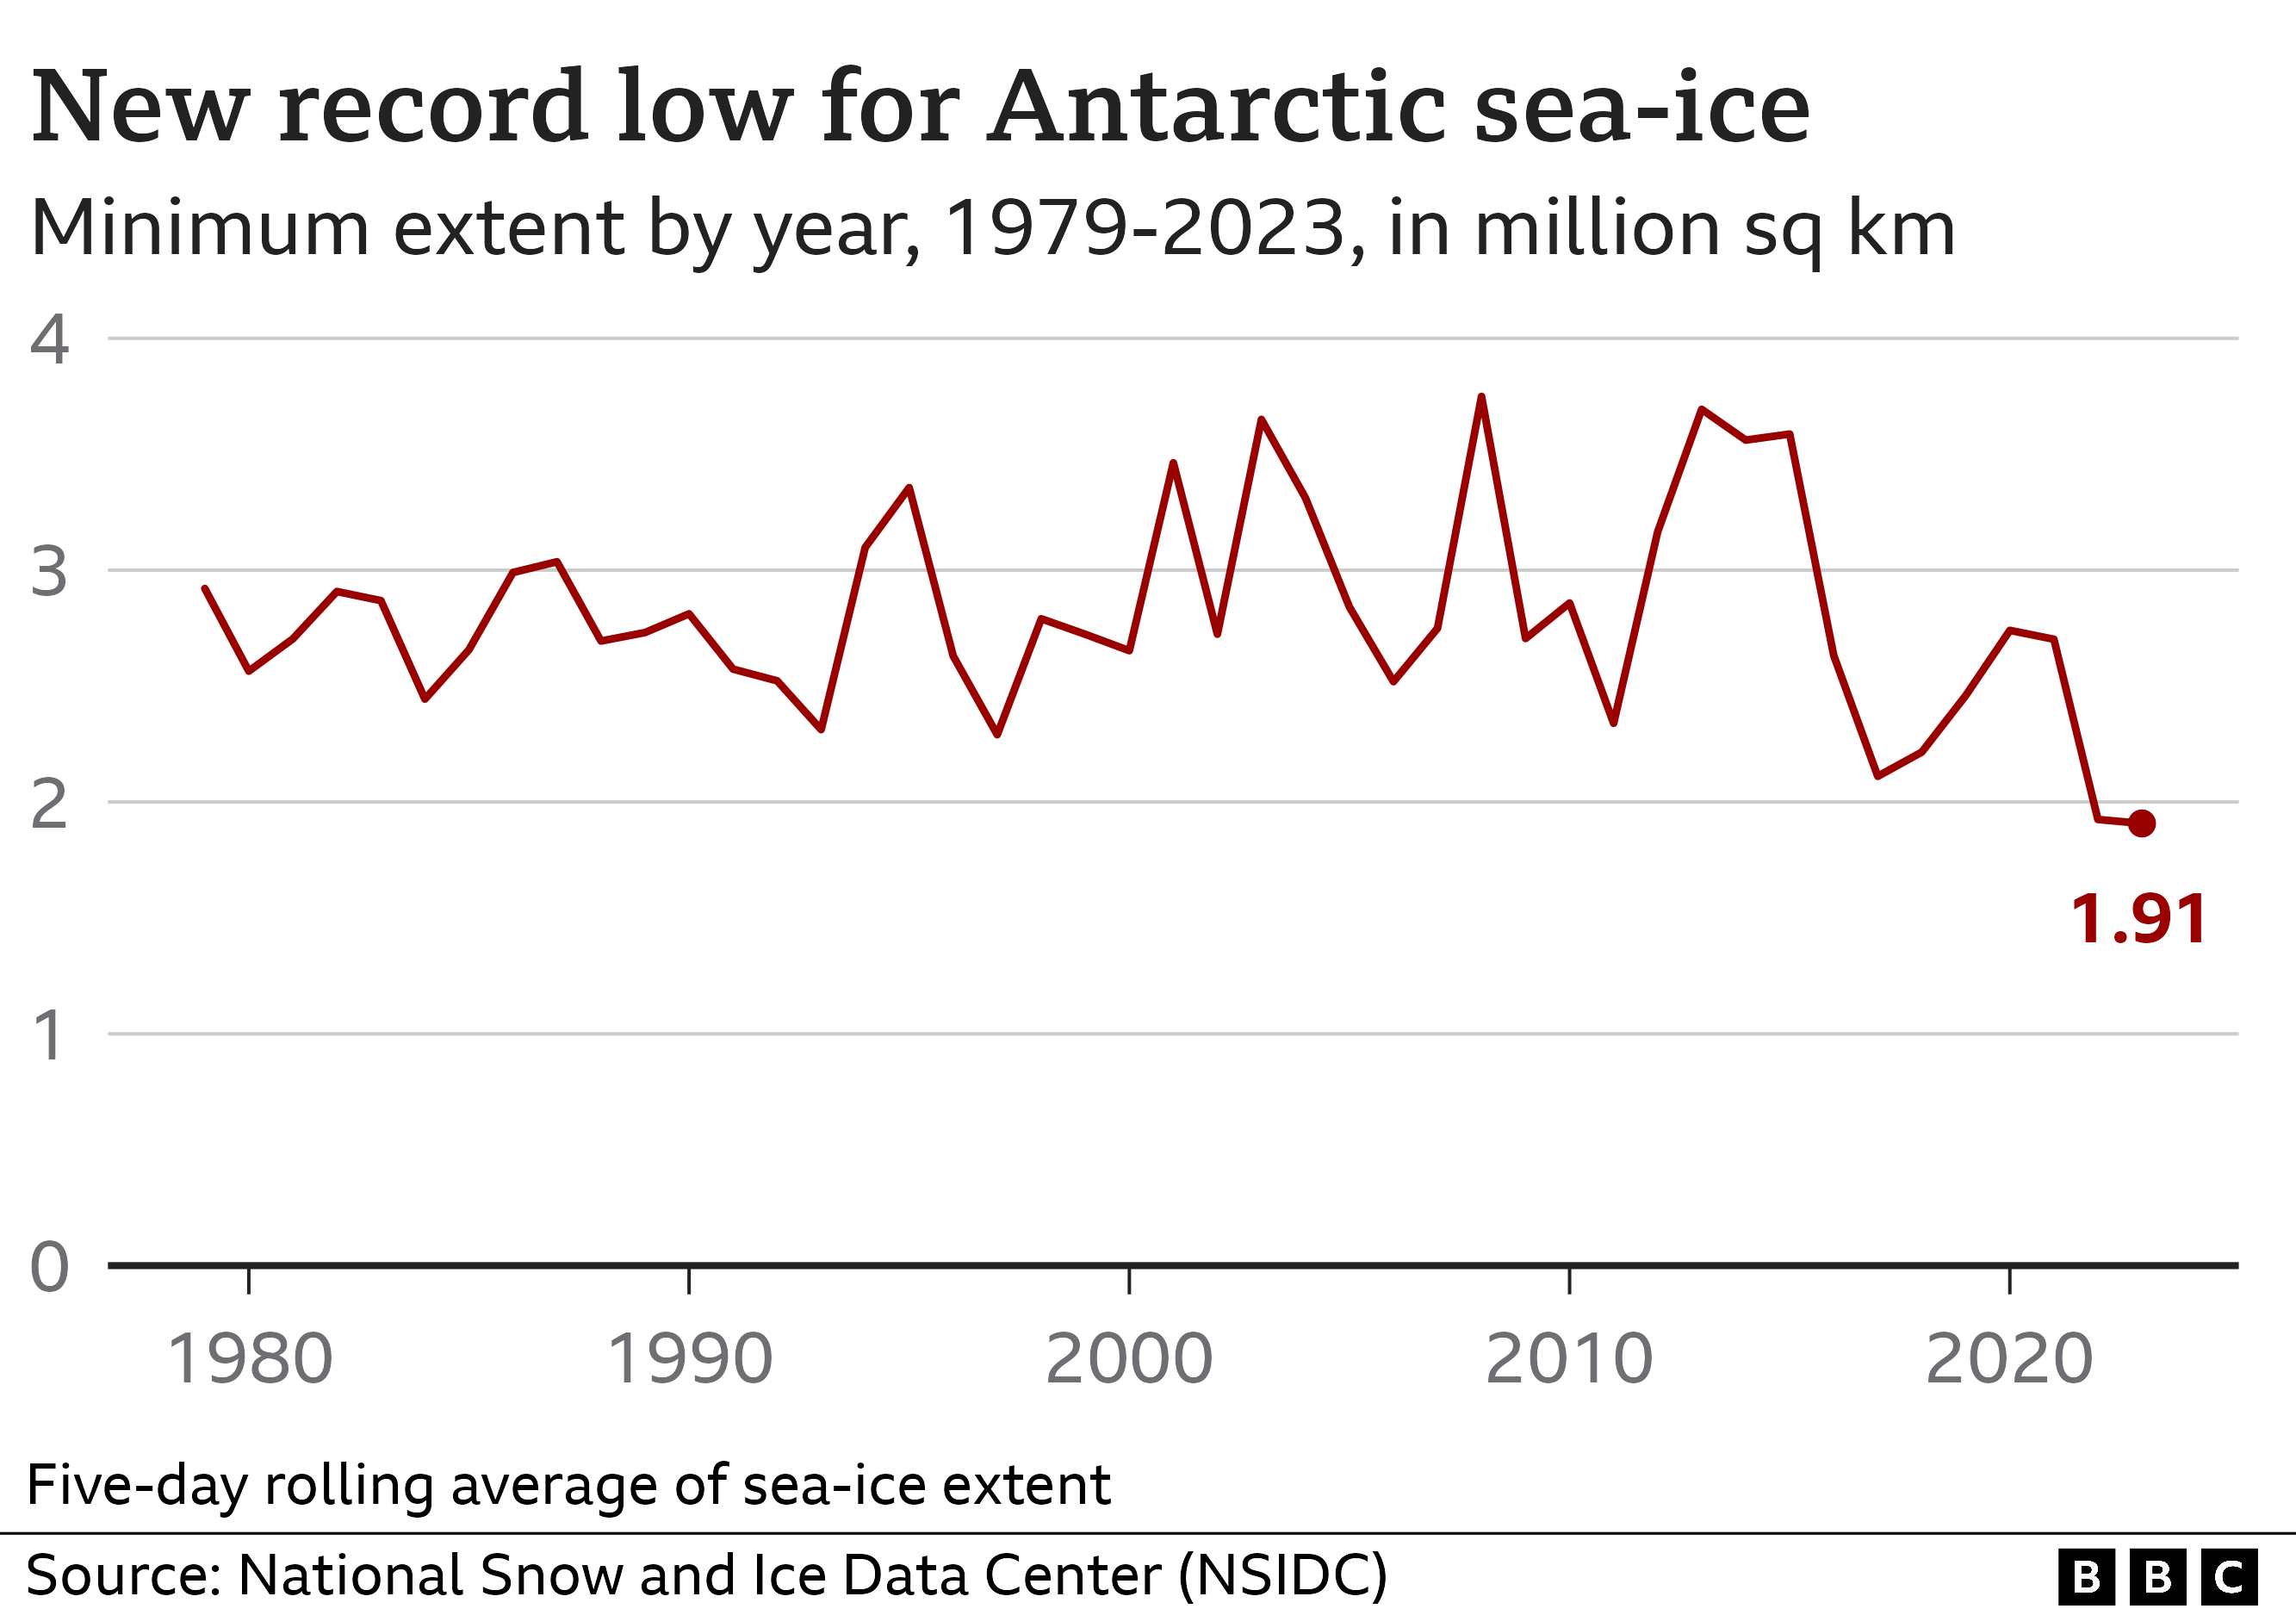
Computer models had predicted that it would show long-term decline, much like we have seen in the Arctic, where summer sea-ice extent has been shrinking by 12-13% per decade as a result of global warming.
But the Antarctic hasn't behaved like that.
Data sources other than satellites allow us to look back at least as far as 1900.
These indicate Antarctic sea-ice was in a state of decline early in the last century, but then started to increase.
Recently it has shown great variability, with record satellite winter maximums and now record satellite summer minimums as well.
In winter, the floes can cover 18 million sq km (6.9 million sq miles), and more.
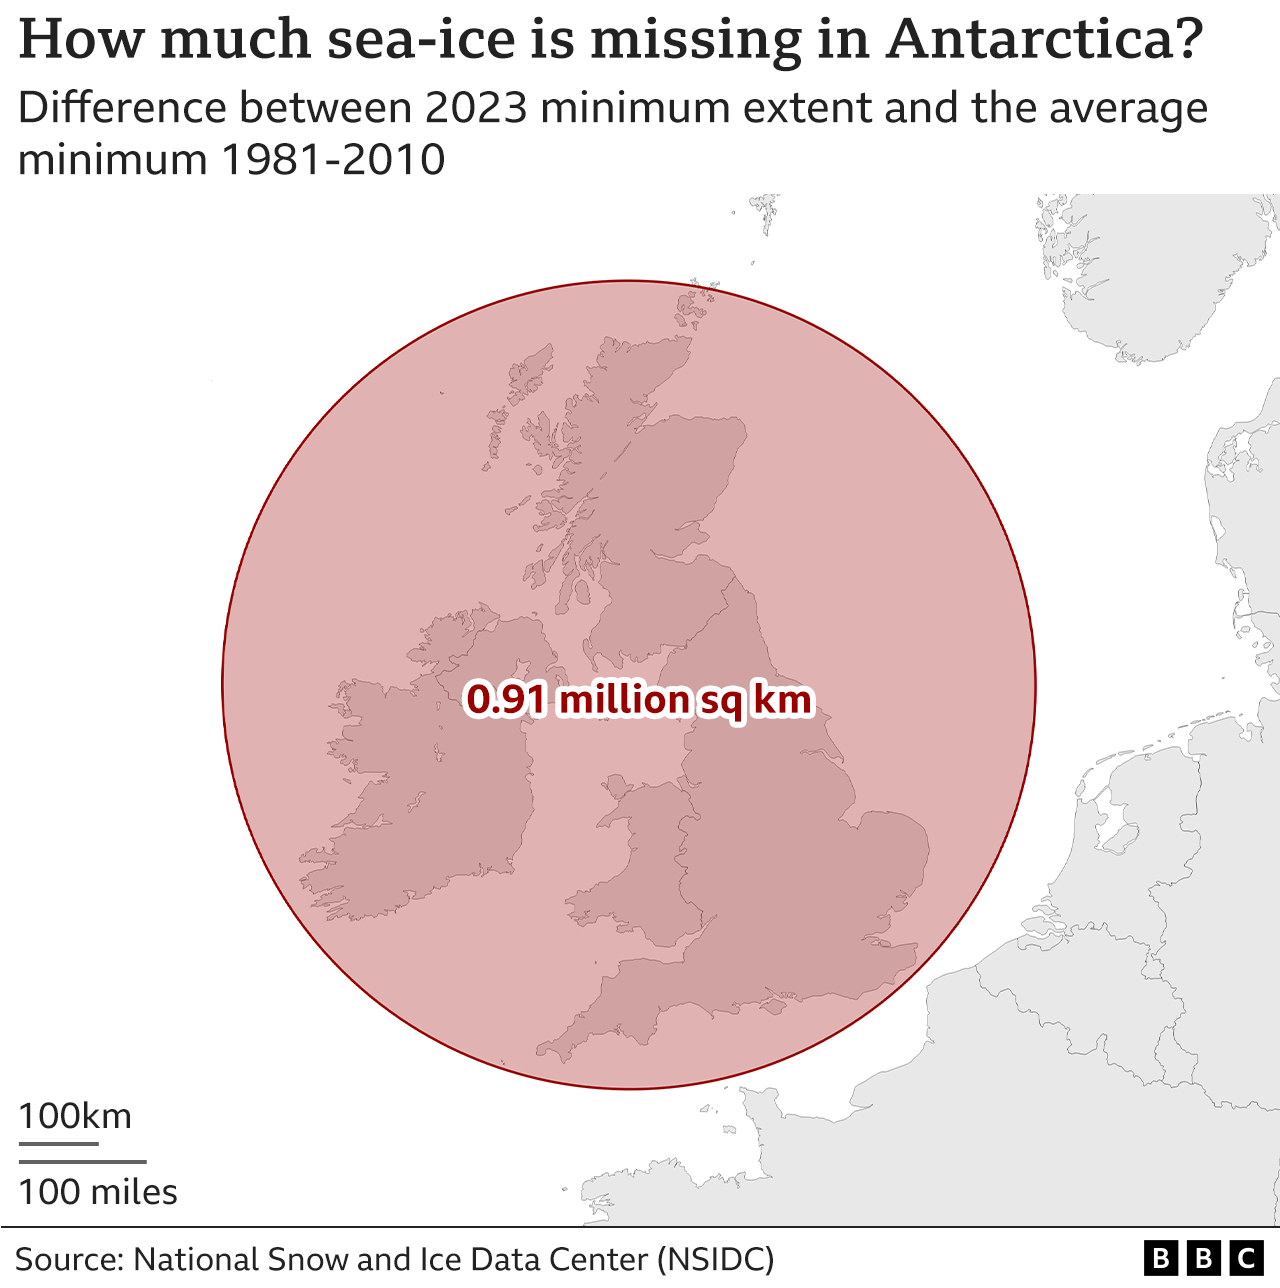
How much ice is a million sq km?
It's broadly what this year's summer ice pack is missing compared with the longer-term average. That's enough to cover the British isles.
It will start growing again very soon and it's important that it does… for a host of reasons.
Freezing seawater at the surface of the ocean expels salt, making the water below denser, causing it to sink.
This is part of the engine that drives the great ocean conveyor - the mass movement of water that helps regulate energy in the climate system.
Sea-ice is also hugely important for life at the poles.
In the Antarctic, the algae that cling to the ice are a source of food for the small crustaceans known as krill, which are a basic food resource for whales, seals, penguins and other birds.
The sea-ice is also a platform on which some species will haul out and rest.
Warm air increasing melt
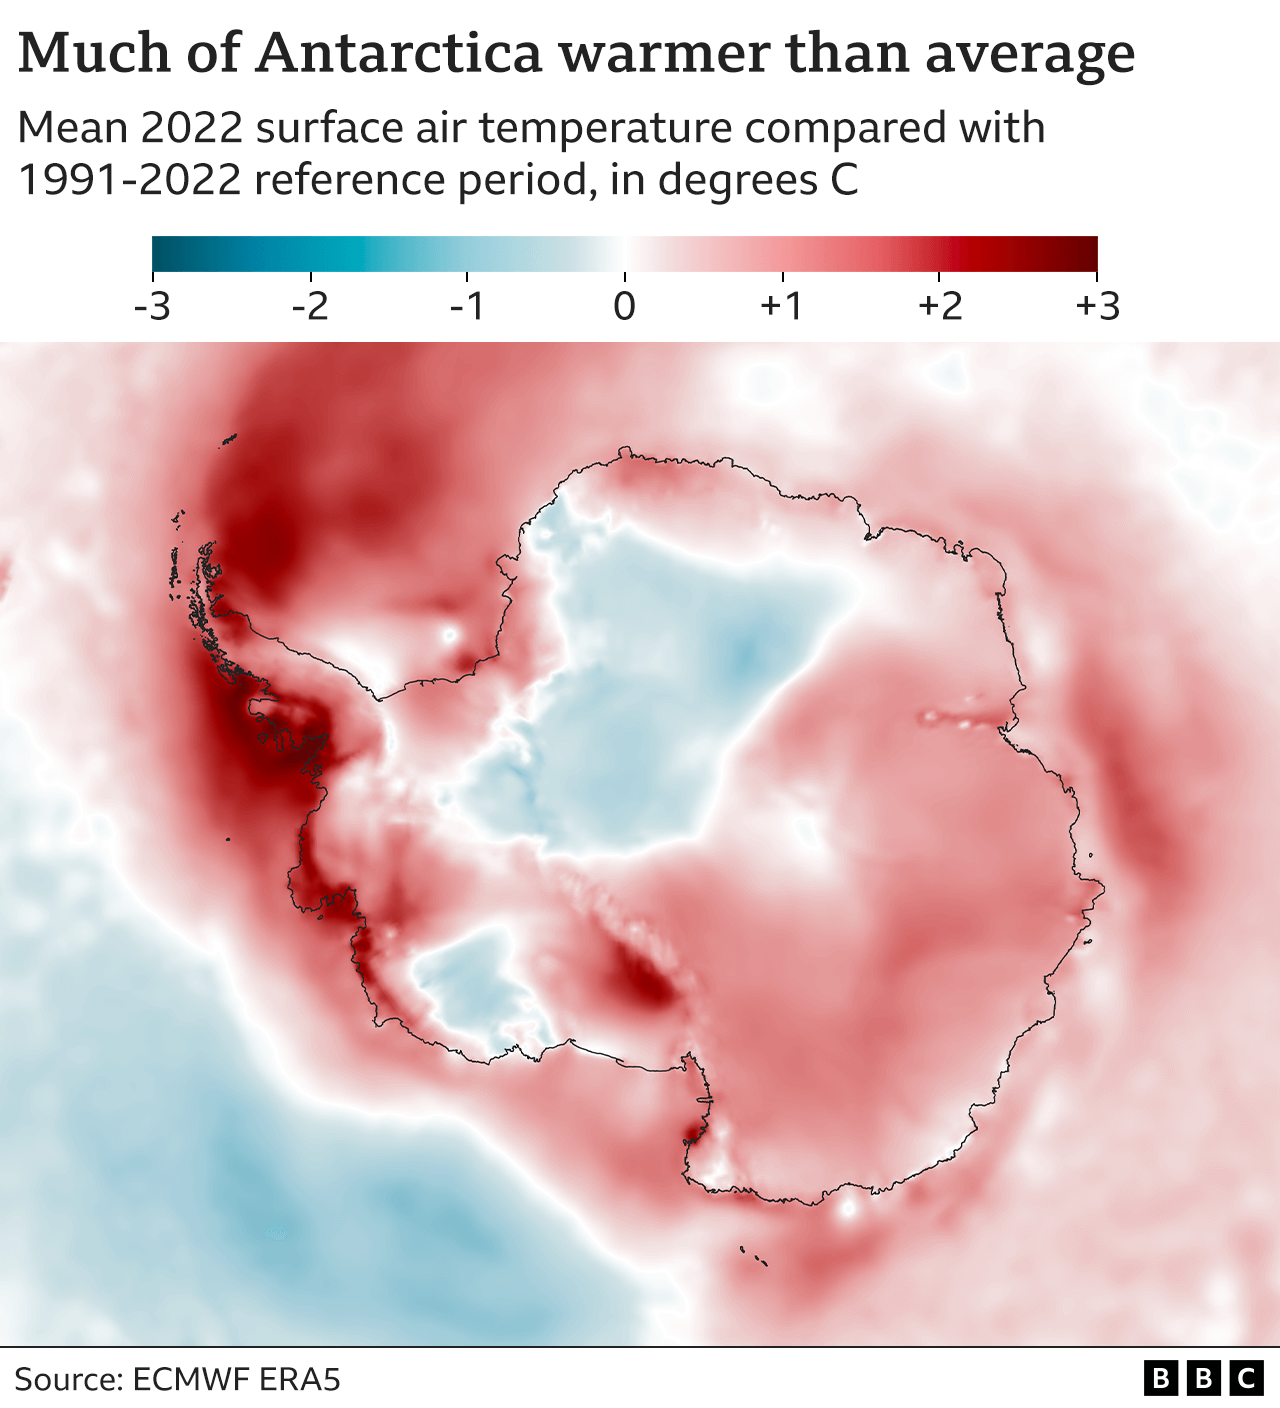
It's likely this year's record sea-ice minimum has been influenced by the unusually high air temperatures to the west and east of the Antarctic Peninsula.
These have been 1.5C above the long-term average.
There's also something called the Southern Annular Mode (SAM), which is a key player in the region.
It describes variations in atmospheric pressure around Antarctica which in turn influence the continent's famous encircling westerly winds.
The mode is said to be in a strongly positive phase at the moment.
This strengthens the prevailing westerlies and drags them poleward.
Increased storminess helps to break up floes and push them north into warmer waters to melt out.
Researchers think the more positive trends seen in the SAM over the longer term are probably linked to the presence of an ozone hole over Antarctica and the rise of greenhouse gases in the atmosphere.
How does this compare to Arctic ice melt?
It's important to understand the differences between the poles.
The Arctic is an ocean hemmed in by continents. The Antarctic is a continent surrounded by ocean.
The divergence in geography means ice growth in winter in the Antarctic is much less constrained. The floes can develop as far north as conditions will allow.
This explains the much larger extents than in the Arctic, where the maximums rarely now get above 15 million sq km (5.8 million sq miles).
But the geography also means summer warmth can chase the sea-ice all the way back to the Antarctic coastline in many places.
And because the Antarctic has difficulty retaining ice from year to year, its floes are thinner than in the Arctic - generally just one metre or less, versus 3-4m for long-lived ice in the polar north.


Add new comment